The Usage Analytics page of the Admin Tool allows Institutional Admins to see, at both high and low levels, data about how assets are being uploaded and accessed.
First, you'll see overall Storage and Bandwidth usage for your entire institution. This represents the cumulative amount of data stored and bandwidth used during the current license year.
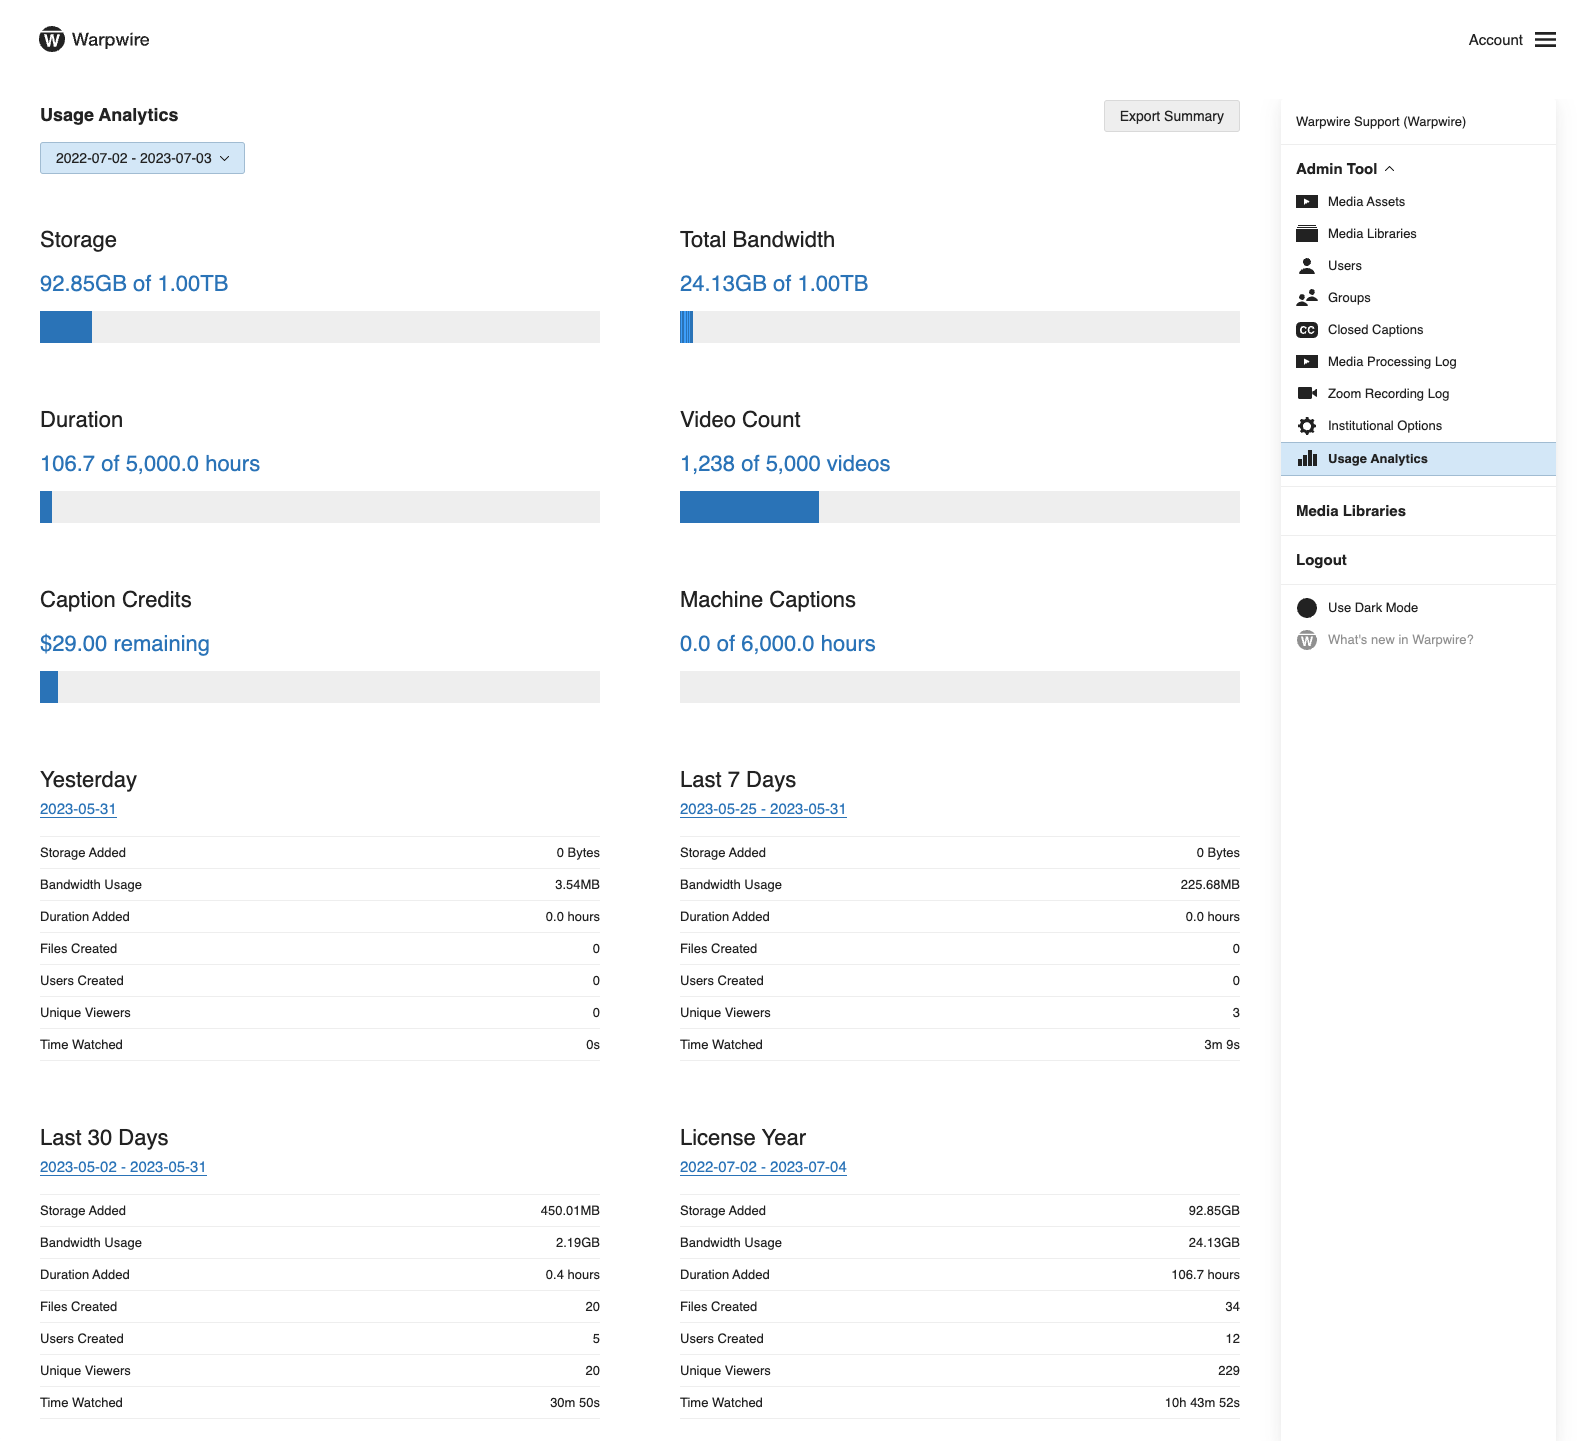
Below, there are four snapshots of more detailed data for the past year, month, week, and day. For each time period, you'll see: Storage Added, Bandwidth Usage, Files Created, Users Created, Unique Viewers, and Time Watched.
If you want to see even more detailed usage information, click the date for any of the four time periods. This will take you to a page showing additional information about usage of Warpwire during the time period you selected.
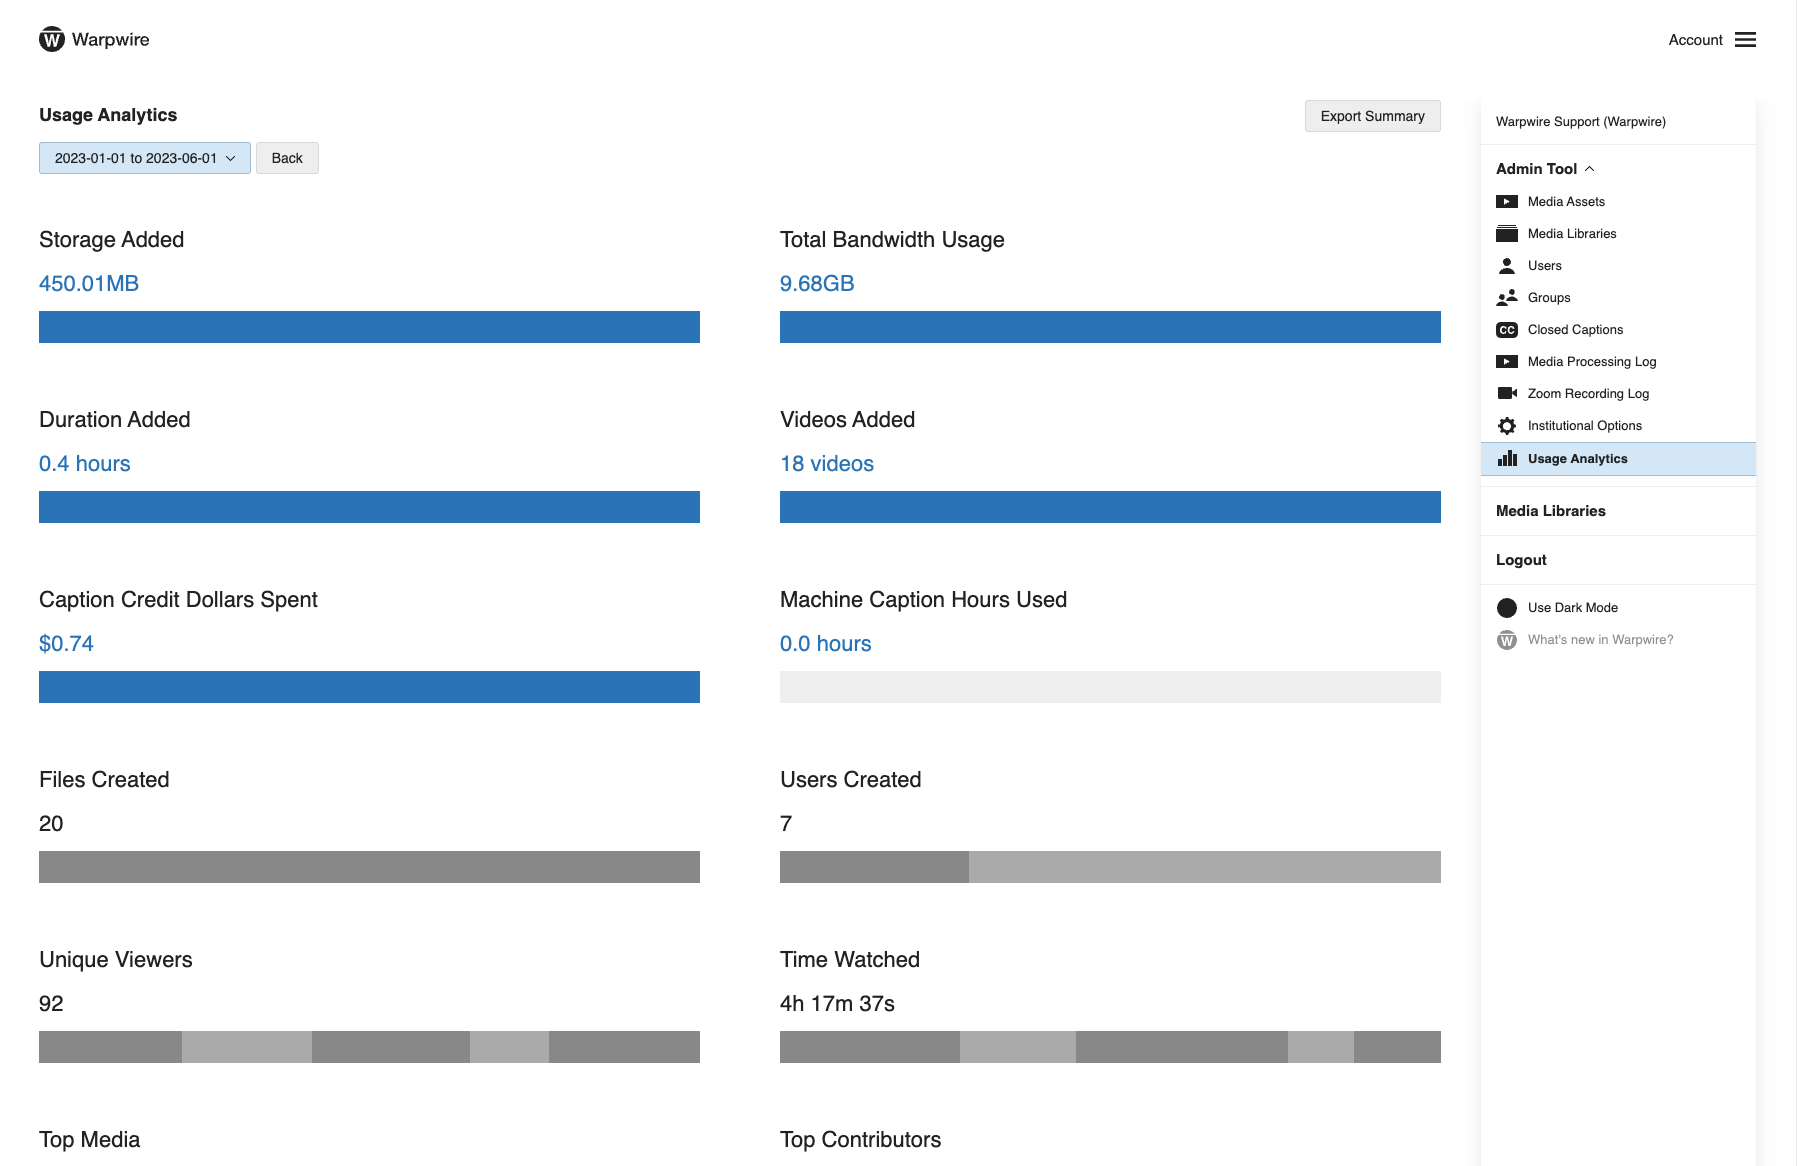
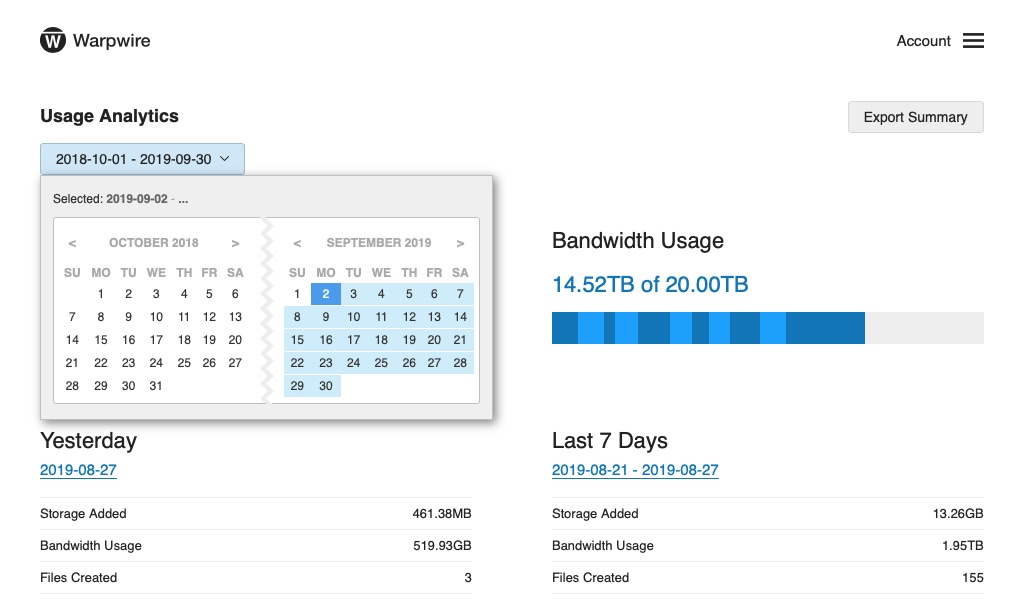
If you wish to see data for a different or more specific time period, you can use the date-picker to select a custom date range.
For the selected date range, you'll be able to see:
The collection of information empowers institutional administrators to notice and respond to usage patterns almost instantaneously. Quickly see power users, popular files, and spikes in usage.
See also: Export Admin Tool Data as a Report and Reporting API.